Chemiscope: interactive structure/property explorer for materials and molecules
Welcome to the documentation of the chemiscope visualization tool, an interactive structure/property explorer for materials and molecules. The goal of chemiscope is to provide interactive exploration of large databases of materials and molecules and help researchers find structure-properties correlations inside such databases. The screenshot below shows an example of such database being visualized with chemiscope. The first part of this documentation describes the default interface of chemiscope and how to use it with your own database, both using the stand-alone viewer or through the python module and/or the notebook widget.
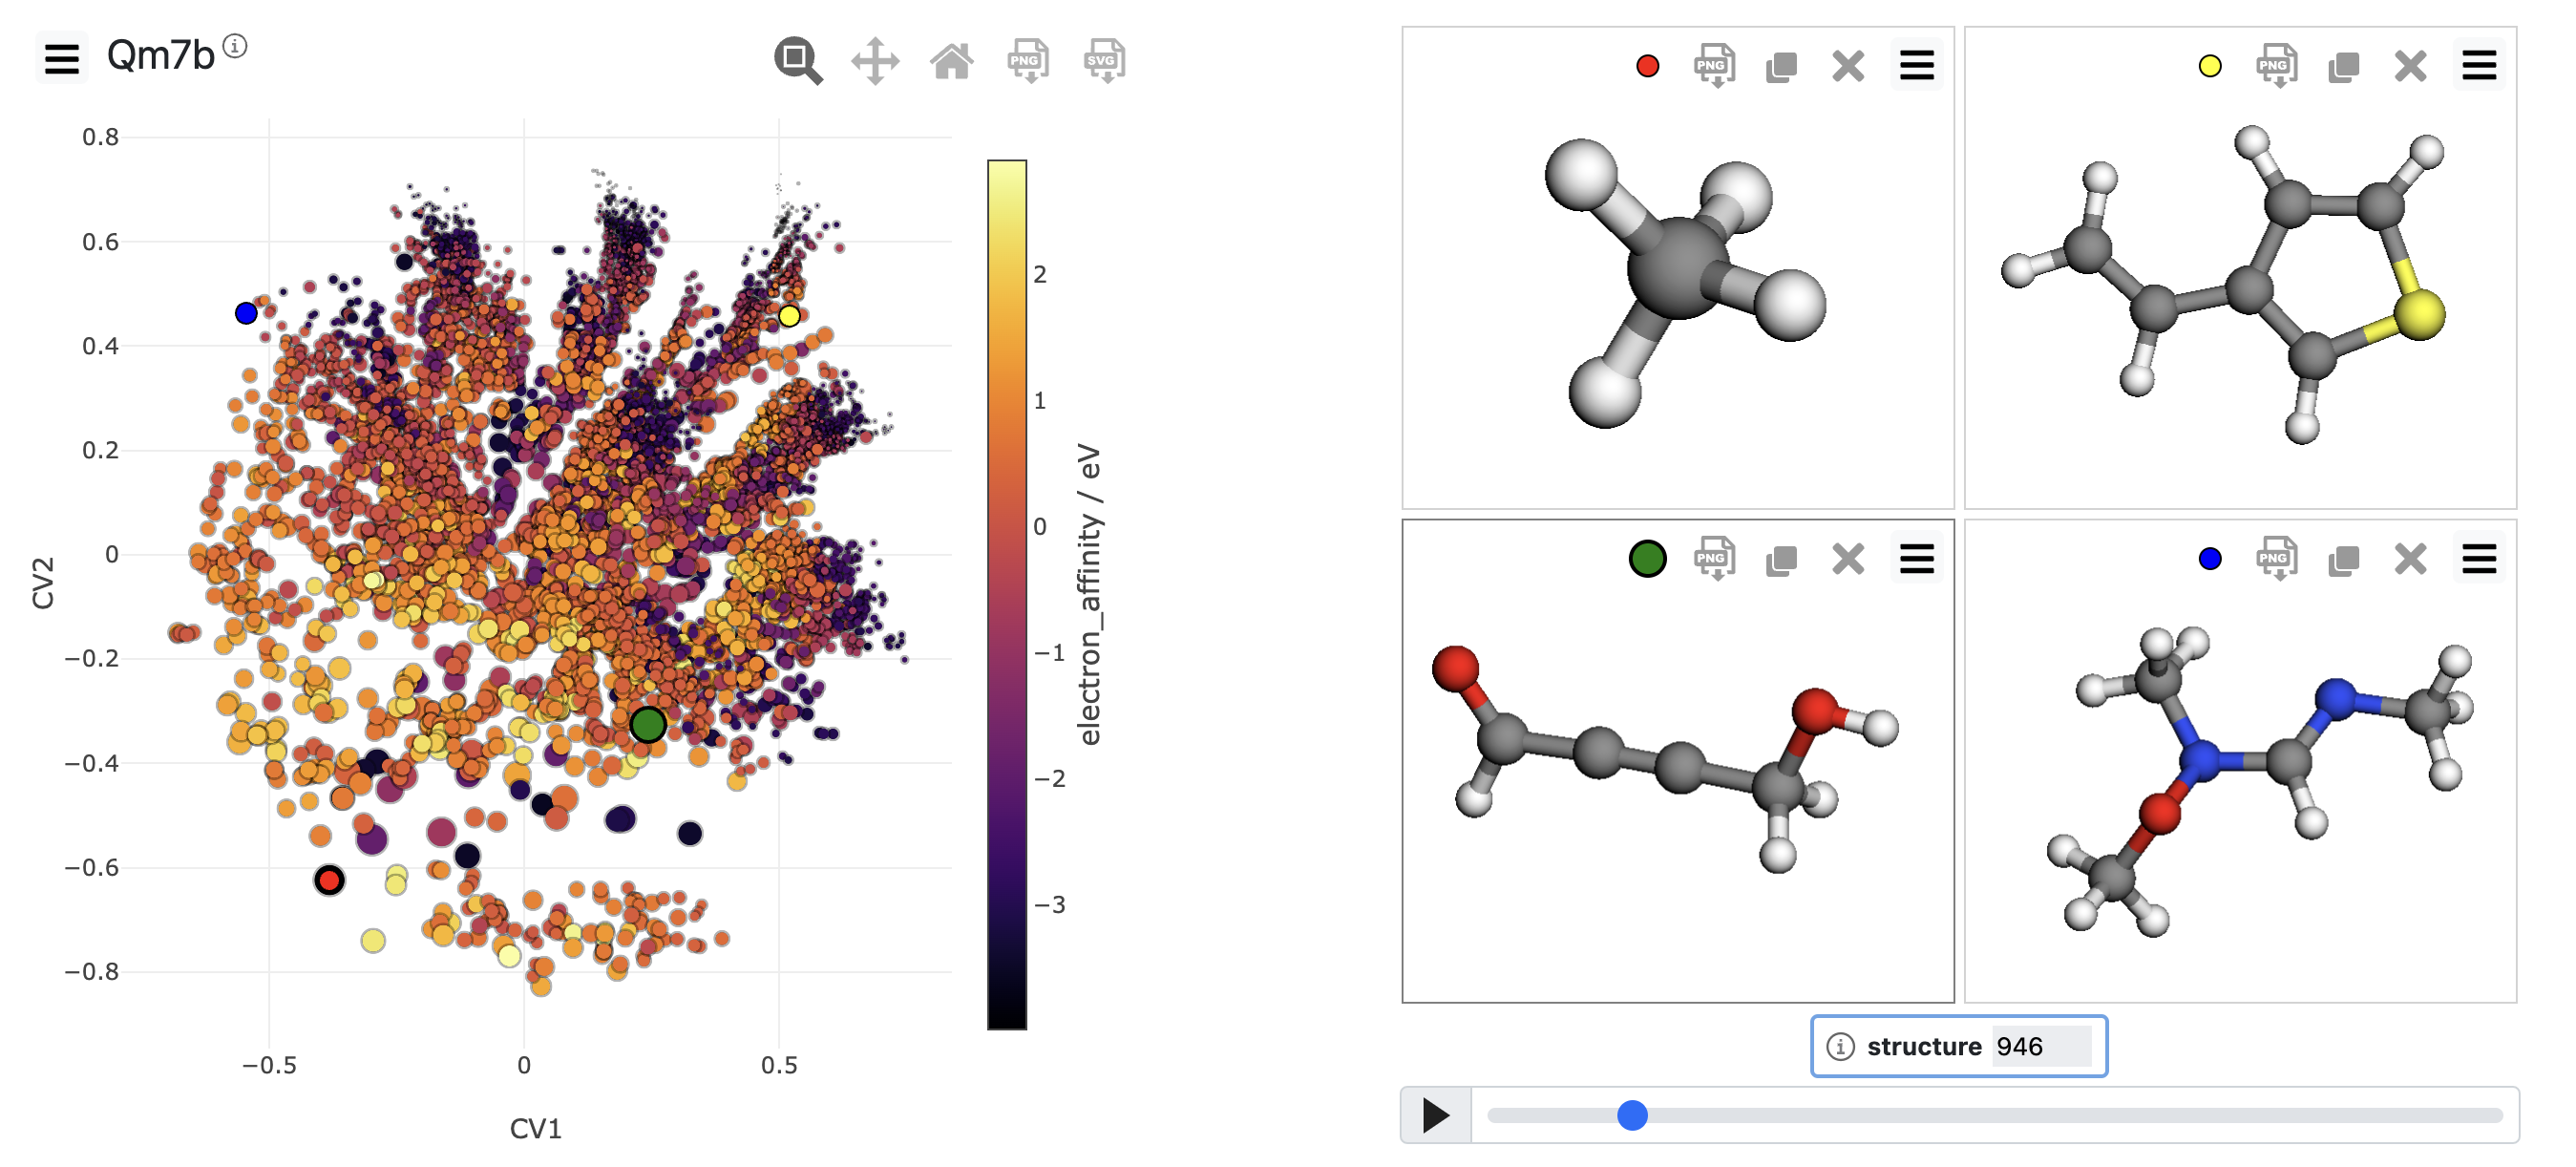
Screenshot of the Qm7b database visualized in the default chemiscope viewer
Chemiscope is built around reusable components that can be arranged in different manners to create visualization adapted to different kinds of data. The second part of this documentation explains how to build the code and use it in your own website to create new interfaces.
Features and capabilities
Chemiscope is designed to visualize chemical structures (using a viewer based on 3dmol.js) together with an interactive scatter plot (using plotly.js) that visualizes the properties associated with each configuration. Properties can be associated with structures (e.g. total energy, band gap, etc.) or with atoms (e.g. atomic charges, coordination numbers, etc.).
The scatter plot can be configured to show different properties on each axis, in two or three dimensions, and further properties can be used to color the points and size them. The user can interactively select points in the scatter plot to visualize the corresponding structures in the viewer, and vice versa. The structure viewer also supports coloring atoms according to atomic properties, and to display additional data in terms of “shapes” (e.g. vectors for forces, ellipsoid for tensorial quantities, etc.).
The code is designed to handle large databases (up to hundreds of thousands of structures) by using optimized data structures and rendering techniques. Structures can be loaded dynamically from external files to reduce the initial loading time, and the scatter plot rendering is optimized to handle large numbers of points, dynamically resampling the data to provide fast interaction at different levels of detail.
Chemiscope can be used as a web-based application, as an interactive notebook widget (in Jupyter, JupyterLab, marimo and Google Colab), as a visualization component embedded in sphinx or sphinx-gallery documentation, as well as a streamlit component.
Getting and citing chemiscope
Chemiscope is distributed under an open-source license, and you are welcome to use it and incorporate it into your own research and software projects. You can get the source from the GitHub repository. If you find it useful, we would appreciate a citation to the chemiscope paper:
S. Chorna, J. Lála, Q. Xu, R. K. Cersonsky, G. Fraux, M. Ceriotti, Chemiscope 1.0: interactive exploration of atomistic data from analysis to dissemination. Journal of Open Source Software 11 (122), 10380 (2026)
The original chemiscope paper may also be cited:
G. Fraux, R. K. Cersonsky, M. Ceriotti, Chemiscope: Interactive Structure-Property Explorer for Materials and Molecules. Journal of Open Source Software 5 (51), 2117 (2020)
If you incorporate chemiscope components into a software project, a link back to the chemiscope homepage is the preferred form of acknowledgment.